In January, The Data Times released an early poll tracker of Virginia’s upcoming Gubernatorial election. A few months later, we temporarily shut it down due to the lack of polls being conducted at the time. Now that the race is starting to pick up, we are launching a new version of the model, which includes county projections and simulations of the election. This is our most complex plurality-vote model yet, and we intend to update it regularly alongside our Trump Approval Tracker.
Last updated and LOCKED on Nov 3, 2025, 9:47 PM ET (Final forecast: 100,000 simulations).
Vote Share Projections
The statewide vote share projections are calculated similarly to our other models, using a weighted average of polls that takes into account recency, sample size, and pollster quality. Just as we’ve done with the introduction of any of our previous models, we’ve made small changes to how some of these variables are calculated. The Recency Score, which typically relies on an adjusted cubic equation, now also uses an exponential and linear equation (with the cubic one holding more weight). These equations are combined to form a more contextualized picture for any given time frame of polls, as some weeks will have many high-quality polls while others won’t.
Additionally, we’ve added four new polling firms to our pollster database. This includes SoCal Strategies, Roanoke College, Christopher Newport University, and Virginia Commonwealth University. Furthermore, the Sample Score has also been adjusted to the polling standard of Virginia, with mid-range polls usually having a sample size of 800. After these scores have been calculated, a final score for the survey is created based on each of these metrics. The Recency Score is the single most influential variable, followed by the Poll Score and finally the Sample Score.
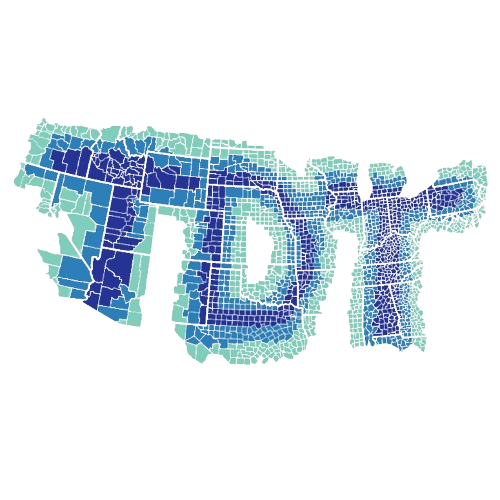
County Projections
For our county projections, we apply a proportional swing from the 2021 election results to each jurisdiction. This is then automatically checked to see if the favored candidate (currently Abigail Spanberger) has been forecasted to receive greater levels of support than their party has in recent years.
Currently, county results are being cross-referenced with the results of the 2017 election. If the projection made by a proportional swing exceeds Northam’s vote share in 2017, a logistic regression tapers off the excess support to avoid overestimating Spanberger. If Earle-Sears were to take the lead, this same methodology would be used to prevent Spanberger from being underestimated in counties that don’t typically swing heavily from year to year.
Election Simulation & Odds
To simulate the election results while adequately accounting for uncertainty, we use a modified Monte Carlo simulation. Rather than simply calculating the deviation based on the overall sample of every poll included in the model, the sample of each survey is multiplied by the poll’s score, with the sum of each product being the sample that the initial margin of error is based on. After this is calculated, the margin of error is further increased based on the time remaining until Election Day. Lastly, the vote share projections used in the simulation assume an even split in undecided voters rather than proportionally splitting them based on current projections.
Attorney General Forecast (NEW!)
Plagued by scandal, the Democratic candidate for Attorney General is facing a tough election bid against incumbent Jason Miyares. Virginia hasn’t had a split statewide ticket since 2005, when Tim Kaine won the Governorship while Republicans won in the LG and AG races. Considering Abigail Spanberger and Ghazala Hashmi are overwhelmingly favored to win their respective elections, it’s entirely possible that partisanship will carry Jones to victory. However, polls suggest a different story.
To counter the potential bias of these polls towards more informed voters, the margin of error is increased by weighting the MoE’s of the polls themselves higher than the calculated sample. Additionally due to the more significant presence of undecided voters in this race, the sample used for the other part of the MoE calculation is reduced by the percentage of undecided voters across all of the polls in the model.
For example, ~7.3% of the public (as of 10/28) is projected to be undecided. The calculated sample size (weighted by the scoring values for each poll) is currently ~4,574. After reducing the projected undecided sample, the calculated sample ends up being ~3,946. Ultimately, this results in an increased margin of error for the Monte Carlo simulation and reduces Miyares’s chances by ~6-7%.
Every time the forecast needs to be updated, the election is simulated 10,000 times. This number is likely to increase as we approach Election Day. And as more polls are released over the next couple of months, our methodology will naturally continue evolving. Currently, The Data Times categorizes the governor’s race as Likely Democrat and the AG race as Tossup. To understand how these labels are assigned, view the table below.
| Categorization | Chance of Victory | Margin of Victory |
| Tossup | <64% | +0-2% |
| Lean | 64-82% | +2-5% |
| Likely | 82-99% | +5-14% |
| Safe | >99% | >+14% |

This is a very intriguing report about this upcoming election, especially with all the data that has been collected and the apparent updates to keep accuracy of who is favored to win.
We have come to you to inform you of our newest poll. We have the Governors race at a margin of 28-21-51 with Donna Charles winning. For the Lieutenant Governor’s race, we have a margin of 38-52 with John Reid winning. Lastly, for the Attorney General’s race, we have a margin of 83-17, with Jay Jones winning MASSIVE bipartisan support, with independents split. Lastly, we project the HoD race to be 99 coin flips with Kathy Tran becoming the new speaker and winning by 1 vote. We project 27 seats to go Democratic, 18 to go Republican, and the rest to all go to the Reform UK Party.