The Democratic Party
is currently favored in the
2026 U.S. House Elections
Nationwide Seat Projections
Vote Share Projections by Party
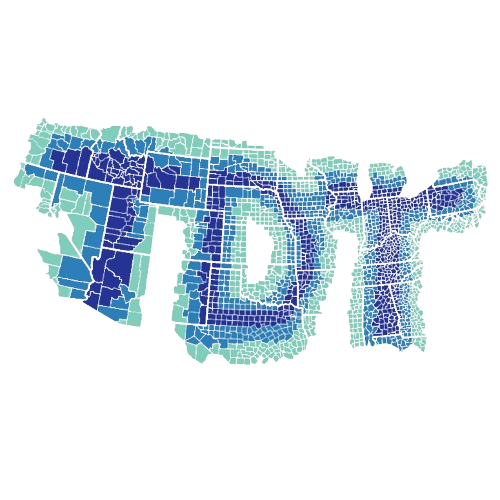
District Heatmap
Seat Projections by Party
Seat Ratings Over Time
House Bias: R +2.56%
This means that Democrats need to win the nationwide popular vote by roughly 2.6 points to secure a majority of the chamber’s seats.
Methodology
Note: This is a brief explanation of the numbers shown on this page. For more detailed information, contact inquiries@thedatatimes.com
The TDT House Forecast is the most complex model we’ve made to date, accompanying large advancements to our polling averages and variable weighting. The core element of the model is the national Generic Congressional Ballot projection. This projection uses a dynamic recency-scoring system, ensuring the model has ample polling data to work with in any given time period. For more sparse polling periods, the model relies on older polls to balance out the average. During periods when many polls are being released, the model automatically filters out older surveys as long as specific scoring thresholds are met. Alongside our recency-scoring for polls, we’ve expanded our pollster grading library to accommodate nearly 90 surveying firms. Lastly, our sample scoring now automatically weights sample sizes based on the groups surveyed.
Surveys that publish GCB results are weighted based on the factors listed above, resulting in a final projection for the nationwide popular vote. Accompanying this projection is our Margin of Error formula, which takes into account variables such as undecided voters, overall survey scores, published MoE data for each poll, specific sample sizes, and the time until election day. Our final calculated Margin of Error aids in the determination of deviations for both individual seat probabilities and overall House control.
Once the GCB and MoE are calculated, the model calculates the relative swing from the 2024 national popular vote (NPV) to the current projections for November. This calculation is then used to apply a proportional swing to every district from their 2024 congressional results. For states that have redistricted since 2024 or for districts that do not have incumbents seeking reelection, the model uses adjusted presidential data as a baseline for the swing. Alongside the proportional swing is a nominal shift in percentage points, reflecting the fact that not every district will swing proportionally (as levels of support are more saturated in some districts than others).
District projections are also calculated using an application of the GCB to the district’s partisan leanings. This variable helps ground the model in some districts while also increasing the shift in others to help account for demographic baselines. The partisanship of a district is based on how its recent voting history differed from that of the nation as a whole. Depending on the state and recent redistricting efforts, these partisan leanings are sourced either from the Cook Partisan Voting Index or calculated by The Data Times internally.
The last primary variable for the House is the district-level polling. These polls are weighted much more simply than the GCB polls, mainly taking into account overall recency and whether or not the firms are sponsored by a party/candidate. Considering Polling data is the only time-sensitive metric out of the four, its the only one that has dynamic weighting calculated automatically.
The odds for a party winning in each district are calculated using a standard distribution curve. They’ll naturally increase as the election approaches, because they use the baseline GCB MoE formula. In addition to this formula, districts with above average projected swings from the 2024 election have increased margins of error to account for the increased uncertainty of the model.
The final forecast for control of the U.S. House is based on the odds of the leading party winning the projected tipping point seat. This seat is determined using the structural bias of the districts nationwide (currently favoring Republicans due to recent redistricting) combined with the GCB projections at the time of modeling. Essentially, this means that the odds for each party winning control are determined by the likelihood of their final NPV margin either overcoming or taking advantage of the national district bias.
Hunter 67