This is the first part of a two-part series ranking election models from worst (15th place) to best (1st place).

There have been countless attempts made by news publications, political scientists, and pollsters to create reliable election forecasts. In the 2024 presidential election, many prediction sites made final estimates of which candidate would win. These sites all used distinct methodologies and ended up with separate predictions. Fifteen of these sites were either mainstream, transparent, or had particularly unique ways of predicting elections. All 15 sites deserve a proper review and analysis based on their accuracy, historical reliability, and future potential. This article has been in development for roughly a month now, and countless hours of writing, research, and data creation have been put into its completion. The second part of this series, focusing on the best election prediction models, will be released in 1-2 months. In the meantime, I plan to write less lengthy pieces. For people who enjoy the more analytical and descriptive parts of data analysis and not the numbers, you can scroll through the methodology portion and skip to the ranking itself. The complete process for some of the calculations used in the ranking is listed below (and subject to change in future election years).
How Are These Models Ranked?
Many different types of models are used in this ranking. To fairly assign a rank in an unbiased way, the following methodology is used:
Probability Forecasts – Tipping Point Brier Score
A Tipping Point Brier Score is a variation of the typical Brier score which rates predictions using the formula of (Chance-Outcome)^2. The “tipping point” part that makes this a variation is introduced for forecasts that include a full electoral college prediction. To put it simply, a weighted average takes the individual Brier score of the prediction of each state and values it based on the likelihood of it being a tipping point state in the election. A lower Brier score is better, with zero being the best and one being the worst.
Vote Share Forecasts – Polling Error Meter
The nationwide Polling Error Meter is calculated based on the individual polling error (the difference between the forecasted margin of victory and the actual margin of victory) of each state which is then weighed based on its tipping point likelihood, similar to the Tipping Point Brier Score.
Once that has been completed, the unadjusted or “raw” PEM has been calculated. The final PEM for each forecast is calculated based on the difference between the previously described weighted average of the polling miss with the margin of victory for the ultimate tipping point state in the election (In 2024, it was Pennsylvania with a 1.7% margin of victory for Donald Trump).
That number is then added to the sum of tipping point values missing from the forecast. This was not mentioned in the probability-based forecasts, as they all include every state. A polling-only model like RealClearPolling sometimes misses several states. In 2024, 99.2% of potential tipping point outcomes were represented by RCP. To calculate the final score, the % missing (0.8 in this case) is added to the PEM. Similarly to a Brier score, a lower number is better. Although every model in 2024 existed in the 0-1 range, a model can get a negative PEM and a PEM greater than one. A negative PEM is ideal, and it shows how much room for error the model had before its prediction would’ve been wrong.
The purpose of the PEM is to provide a simple way of measuring vote share-only forecasts while also providing an additional metric to rank probability forecasts that also project vote shares. Although some models don’t meet these exact parameters, they can all generally fit into the two broad categories of vote share versus probability. The rankings listed below include many different factors outside of these two final calculations as well, as the methodology and/or future reliability of some of these models may not be accurately represented by two numbers.
15. Polymarket (State Weighted Brier: 0.176)
Polymarket and betting markets as a whole rank last on this list for many reasons. Even if Polymarket predicted every state correctly with 100% certainty and got a Brier score of 0, it would still be ranked last. This is simply because Polymarket isn’t an actual forecast, and the people who frame it as such are wrong. Relying on Polymarket for an election prediction is the equivalent of asking a random stranger who they think will win the election and basing their validity on how much money they’re willing to throw away to give you the answer.
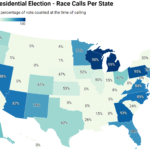
Voting in an election doesn’t cost money, and it attracts a completely different crowd than the one represented by Polymarket. The vast majority of people betting on any of these markets aren’t election experts, and the “predictions” that are made for each state are deterministic. This factor wouldn’t be too much of an issue if it weren’t for Polymarket itself to label the amount of money going into one candidate as the “chance” of them winning and then shading their electoral map according to the volume of funds invested. A perfect example of where this can go wrong occurred on election night. If you looked at Polymarket’s electoral map at 8:00 PM Eastern Standard Time, you may have noticed that Washington, D.C., was tilting red for Trump.
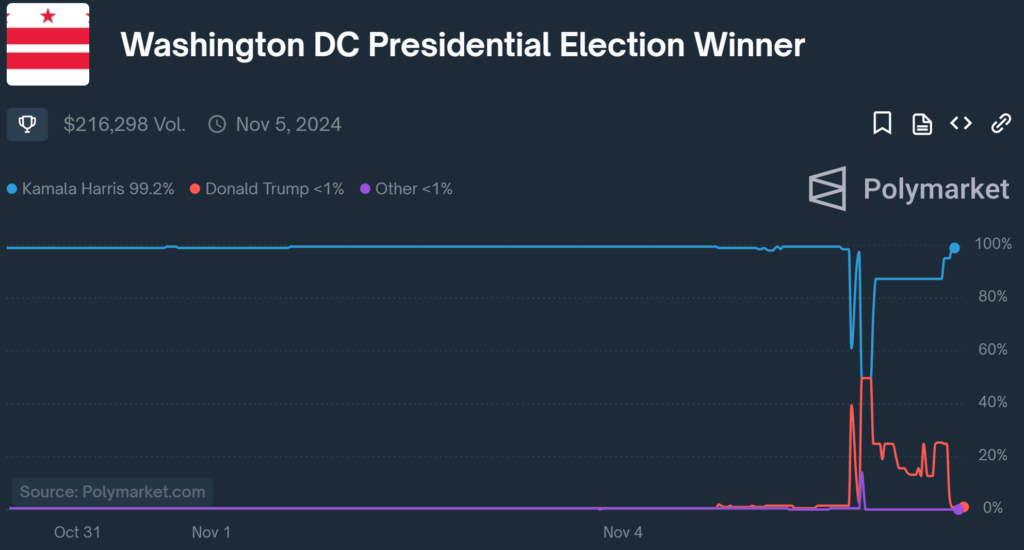
To put this into perspective, Washington D.C. was won by Kamala Harris with a staggering 83.8% of the vote. This was a stronger margin of victory than any other presidential voting constituency in the entire country. Yet, for some reason (potentially bots being sent to the wrong market for a few minutes), it was flipped red in Polymarket’s forecast. So, why was Polymarket correct this time? Well, any election market will be correct in a 50/50 race if a billionaire funding one of the candidates decides to tell everyone to bet on said candidate winning.
14. The Primary Model (National Brier: 0.563)
This is the first fundamentals-only forecast on the list, which is a term I’m using to describe any forecast that goes unchanged throughout the election season. This fact makes The Primary Model quite a pivot from Polymarket, considering Polymarket essentially changes every minute. Another potentially more distinguishing difference is that The Primary Model incorrectly predicted a Kamala Harris victory last November. Not only did this model fail at correctly predicting the 2024 election, it also got the 2020 election wrong. That level of inaccuracy back to back makes it the only model on this list to have gotten both of the two most recent elections incorrect. Even the creator of the model himself wrote, “the forecast of a near-certain Trump victory strains credulity” when releasing their prediction of a 91% chance of Trump winning reelection in 2020.
To put it simply, The Primary Model uses the results of each candidate’s primary elections in New Hampshire (because of its independent voter base and early elections) as well as South Carolina (because it has a more diverse population that Democrats rely on for elections) to determine the likelihood of a candidate winning in the general election. And to be fair, the model correctly predicted the winners in nearly every election from 1912 to 2016.
The model itself is executed pretty well and provides a lot more insight than Polymarket. However, its future reliability has been put into question in recent elections. The concept also has many flaws, as voting demographics in each state change every election cycle, and incumbent candidates will always be favored in their primaries. For those reasons, the model isn’t fundamentally reliable.
The Primary Model’s EV Errors
13. The Virtual Tout (EV Difference: 32)
The Virtual Tout is an electoral vote forecast that relies primarily on betting markets and Allan Lichtman’s 13 Keys (more on that later). The creator claims that betting markets are more useful than opinion polling because they change rapidly. The issue with this thinking is that the only reason for the quick updates of betting markets is that they aren’t scientific and don’t rely on any process to accurately sample a population. More importantly, someone saying they think someone will win an election doesn’t mean that’s the person they’re voting for.
At this point, many of my critiques of this site heavily overlap with those of Polymarket. However, there is a distinct aspect of this model that separates it from both betting markets and the vast majority of other forecasts. Its predictions heavily swung back and forth throughout the election season to the point that it lost much of its remaining reliability, regardless of the accuracy of its eventual prediction.
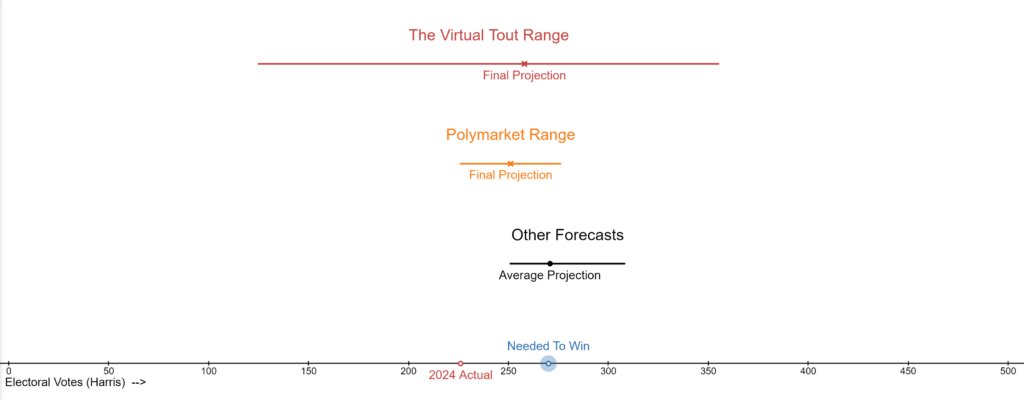
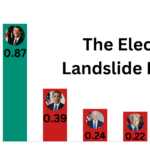
For the model to arrive at its final projection, it first predicted a Harris landslide and a Trump landslide multiple times. If the election had happened on any of those days, it would’ve been completely wrong. The range of the betting markets themselves (as displayed above with Polymarket) was much more tame. Even PredictIt (the market used in this model) stayed below the 65% range for either candidate’s winning chances and predicted a Harris win on Election Day.
The other large contributor to the forecast was the 13 Keys, which were weighed in this model by their significance to a candidate winning (determined by the creator’s methodology and not the key significance values used later in this article). This part of the model suggested a ~75% probability of Harris winning, and all 5 of the most important keys were rated true (which equates to helping the incumbent party). The fact that both of the primary indicators of this model’s forecast pointed toward a Harris win, and it still predicted a Trump victory points to some forecasting gymnastics that were at play in this model’s success.
12. CNalysis (State Weighted Brier: 0.465)
I was initially hesitant toward putting a full-fledged poll + fundamentals forecast this low on the list, considering they usually have great methodologies. However, CNalysis (not owned by CNN, despite the beginning of its name) majorly overestimated the Democratic party in both 2020 and 2024.
Some of the more egregious offenses of this model included both the 80% confidence that Georgia was going blue (despite many indicators it wasn’t) and a 70% chance of Pennsylvania going blue, even though it was considered a tossup by essentially every other forecast and ended up voting to the left of Georgia. Labeling Wisconsin and Michigan as blue were two predictions roughly on par with most other averages we’ll explore further up the list. However, putting any of these states beyond the lean category, especially considering the eventual results of the election, was not based on reason. CNalysis also predicted North Carolina, Maine-CD2, Florida, and Ohio would all go to Biden in 2020. These predictions turned out to be wrong, though they were still mostly aligned with the more mainstream forecasts at the time. The site also lacks a vote share projection, being one of the few probability-based prediction models (alongside Sobato’s Crystal Ball) that only has likelihood ratings.
11. RealClearPolling (State Weighted PEM: 0.767)
RCP is a polling average that relies solely on data from unweighted polls, regardless of how good those polls are. It’s a site that anyone can put together by themselves with minimal knowledge of data and political analysis. The only way one could describe its success in recent elections is by saying the site got lucky. It correctly predicted that Trump would win in 2024 and that Biden wouldn’t win a landslide in 2020. However, it overestimated Republican support in the 2022 midterms (by as much as 11.5 points!) and in many states during the recent presidential election. RCP’s limited success comes from its lack of pollster weighting because highly rated polls usually favor Democrats.
This isn’t necessarily caused by flaws with the polls or their methodology. Instead, it’s most likely the result of broad Democratic support that doesn’t always translate to voting. Contrary to popular opinion, voter turnout was a significant factor in the Democrat’s loss of the popular vote (though that’s a topic for another article). Republicans, on the other hand, have a robust voter base that is incredibly motivated to make their voices heard on Election Day due to the polarizing rhetoric of the party’s leadership. This process has allowed Republicans to be quieter in the polls but more loud in voting booths.
Although the GOP base is slightly overshadowed in many mainstream polls, their opinions are overcompensated in some cases by the many Republican-sponsored polling firms that consistently invade RCP’s unweighted average. It’s worth noting that some sponsored polls aren’t added to RCP’s average; for example, the co/efficient poll held recently in Virginia for its governor race this year. However, the methodology of removing some sponsored polls without any quantifiable reasoning is flawed.
The site is cherry-picking which polls should be added to clean up its average. This isn’t a scientific approach and results in unreliable data, regardless of its previous successes. There are many better ways of running a polling average/forecasting site while still including sponsored polls. The Data Times 2025 VA Gubernatorial forecast (subtle advertisement) included the co/efficient poll while having a data-driven methodology to reduce its influence on the average. This methodology is seemingly absent from RCP, making the site fundamentally unreliable.
It’s also worth noting that sites based purely on polling averages require a substantial amount of polls to be done in a state before an average can be made out of it. This has led to RCP not having a polling average in many states and subsequently having a tipping point representation of only 99.2%, the lowest out of any forecast on this list.
Additionally, RCP has incredibly inconsistent state probability ratings. In 2020, Minnesota was categorized as a “tossup” despite RCP’s average having the state as D+ 4.3. A margin of that size would generally be considered to be leaning Democratic. RCP instead decided to give the leaning classification to states like South Carolina, which ended up being R+ 11.7 in the election. That margin is just roughly three points away from being considered solid/safe by consensus ratings.
10. The Keys to the White House (2024 Brier: 0.828)
In 1982, Professor Allan Lichtman made his first official prediction for the presidential race of 1984. His methodology doesn’t use polls, betting markets, primary results, or any combination of those metrics. Instead, his prediction is based purely on the fundamentals of the race. Lichtman justified the validity of this model by citing the unpredictability and rapid day-to-day changes of polls. This model is commonly known as The Keys to the Whitehouse, and it even has a website. Lichtman correctly predicted Reagan would win in ’84 and continued to be undisputedly correct until 2000, though the true winner of that election is still up for debate today.
Lichtman’s model is quite simple at its core. There are 13 fundamentals or “keys” in an election that the party in power is defending to hold control over the presidency. The goal for the incumbent party is to have at least eight keys labeled as “true” while the opposition is favored to win if at least six of them are “false.” According to Lichtman, the model is deterministic, and the specific amount of keys (aside from the minimum required to win/lose) doesn’t indicate other metrics, such as the percentage of the popular vote that the candidates will garner.
Lichtman has changed his story to reflect what the Keys specifically predicted. Before 2000, he claimed that they only predicted the winner of the popular vote. After that election, he “switched” the keys to predict the winner of the overall election instead. This doesn’t make any sense, as the model stayed the same, and it has fundamentally always predicted the popular vote. Not a single one of the keys has to do with the Electoral College, therefore, the idea that the keys somehow predict that instead of the national vote is simply untrue. Lichtman has argued that because 91% of the candidates who win the popular vote also win the election, the model does technically predict the winner of the electoral college. I’m willing to accept this argument and say that Lichtman’s technically predicting the winner of elections with 91% certainty. This led to Lichtman’s model having the highest Brier this cycle, considering it meant that he forecasted a 91% chance of Harris winning the election.
What isn’t often discussed by Lichtman’s followers is the 2016 election. Lichtman uses this election to argue for his model’s superiority because he predicted a Trump win, while most polling forecasts predicted a Clinton win. However, I’d argue the exact opposite in this case. We’ve previously established that this model predicts the popular vote at its core, and Hilary Clinton ultimately won the popular vote. His model was technically less correct in 2016 than it was in 2000, and yet he claims this 9% chance as a win for the Keys. If polls ever missed the mark with a confidence interval of 91%, people would accuse the administrators of committing a crime (not hyperbole, by the way).
Considering what I just wrote, this may seem surprising to some people, but I’m quite a fan of Lichtman. His predictions have usually been correct, and even the ones that aren’t have provided much-needed insight into our elections. In the aftermath of his first undisputed loss in the 2024 election, many people accused his predictions of being biased toward Harris. This logic is incredibly flawed. And as Lichtman has pointed out, he had previously predicted candidates such as Reagan (and Trump) to win their elections.
The biggest critique that I have with the Keys is they don’t account for public perception. Sure, Biden’s administration had a strong short and long-term economy (the economy wasn’t in recession, and real economic per capita growth exceeded the previous two administrations), but the American people didn’t consider their current economic situation adequate. Most voters cited the economy as their primary issue when voting in the election, and most of those voters ultimately voted for Trump. The Keys also lack nuance and coefficients, as some keys have shown to be more influential over the results than others.
Kamala Harris had four keys against her when going into the election. This was a relatively comfortable margin, with the key significance values indicating a 70.45% chance of her winning. However, the unprecedented conditions of this race could’ve flipped some of these keys. Although Lichtman flipped the Incumbent Seeking Reelection key, the No Primary Contest key remained true. Lichtman’s reasoning for this was that Harris was essentially instantly endorsed by the party following Biden’s dropping out of the race. To counter that, I’d argue that there was a primary contest between Biden and Harris themselves. The lack of time that Harris had for campaigning and the split that ran through the party before Biden took his name out of the ring were factors that hurt her candidacy in the following months. The simple fact that multiple candidates were viewed to be the party’s nominees at different times and the disarray caused by it supports making that key false.
Flipping that key would’ve dropped her chances down considerably to the point of the race being compared to a slightly weighed coin toss, with the chance of an upset much higher. Lichtman could’ve also flipped the Major Foreign/Military Success key, which would’ve changed his official prediction in favor of Trump and resulted in another win for his model (though the key significance model would still tilt toward Harris). In his defense, he did say that military success was a “likely” key and not an official designation. However, it didn’t make too much sense to even put it in Harris’s column to begin with. Lichtman cited the military aid being sent to Ukraine as a military success, but most people considered it wasteful foreign military spending, and the Republican party used it in their campaign against Democrats. To clarify, I don’t necessarily agree with the opposition to foreign aid to Ukraine, I’m just pointing out that labeling it as a success in the general public’s eye was the wrong move.
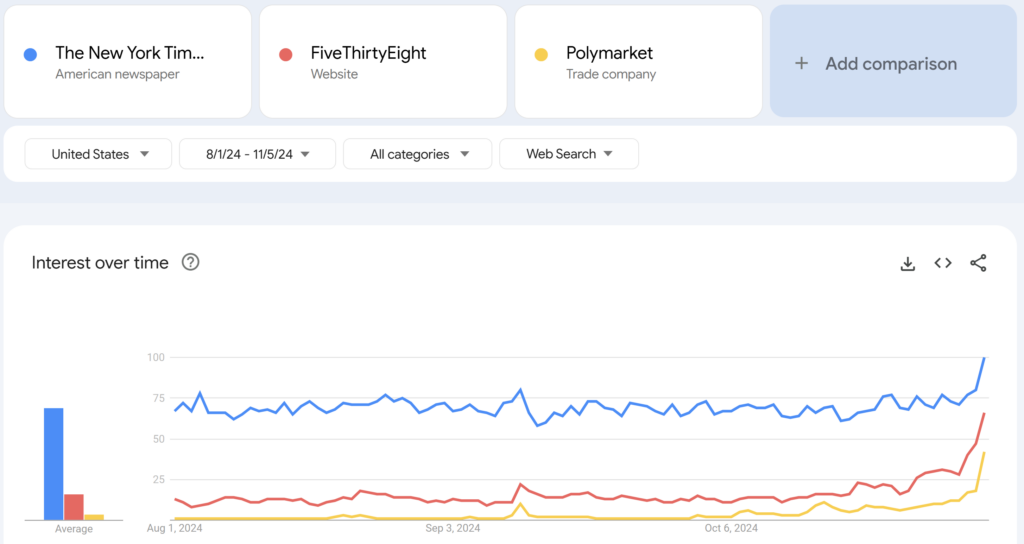
9. New York Times (2024 PEM: 0.870)
The New York Times was a very prominent publication during the election season. From August 1st to November 5th, approximately 75% of searches for any of the forecasts or polling trackers on this list were directed toward the site.
At this point on the list, arguably starting with Lichtman’s keys, the ranked models aren’t necessarily “the worst” by themselves. For people wanting simple polling averages or fundamental-based predictions, sites like the New York Times or the 13 Keys can provide that with a clear user interface and solid analysis. Simply put, these models (in the middle/slightly lower parts of this list) are mediocre in comparison to the best probability-based forecasts out there. The New York Times tried having a full probability forecast in 2016 but decided to switch to simple polling averages in 2020 and didn’t revert in 2024. One of the reasons NYT placed slightly low on this list was due to its incredibly high PEM. The New York Times had the highest Adjusted PEM out of every single vote share-based forecast on this list.
Although NYT correctly predicted the four Sun Belt swing states, they got all three Rust Belt states wrong. Notably, the publication also had a polling error of more than 10 points in Iowa. This was likely driven by Ann Selzer’s poll in the state which had Harris winning by 3 points. And to be fair, her poll had a very high rating and accurate track record. The New York Times could’ve still avoided this inaccuracy, though. Including fundamentals and probability estimates would’ve increased its rating and reliability, especially for the wide range of readers the publication gathers during the election season.
The Final Ranking, as of Part 1
A link will be provided here when the second part of this article is released.
| Not Currently Ranked 1-9 (In alphabetical order) | 538 Dave Trotter’s Voting Trend JHK Forecasts Princeton Election Consortium Race To The Whitehouse Silver Bulletin Sobato’s Crystal Ball The Economist |
| 9 | The New York Times |
| 10 | The Keys to the White House |
| 11 | RealClearPolling |
| 12 | CNalysis |
| 13 | The Virtual Tout |
| 14 | The Primary Model |
| 15 | Polymarket |