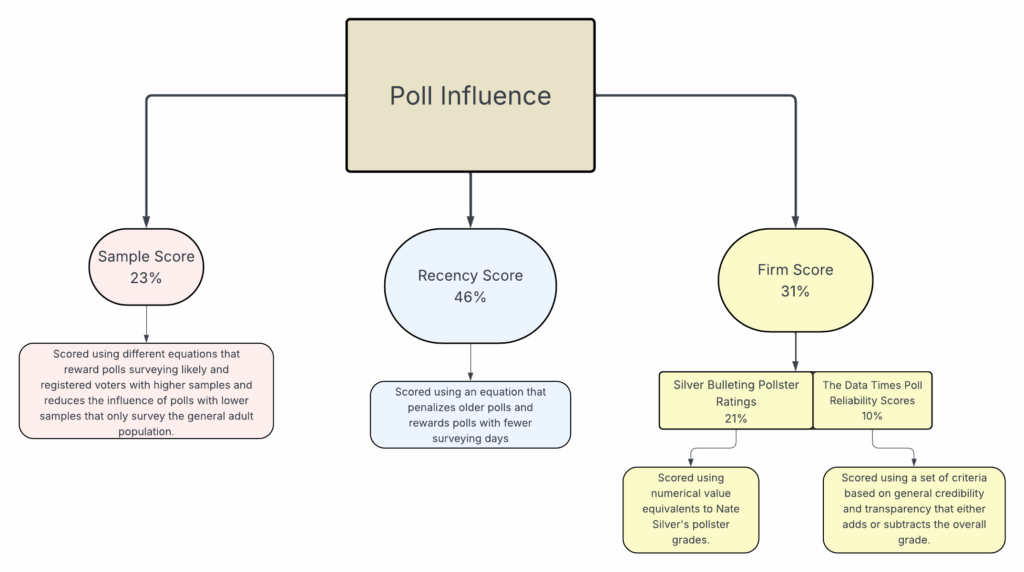
Methodology Chart Recent Updates: 9/2/2025: Type of sample (A, RV, LV) no longer affects the sample score of a poll 8/27/2025: Any polling firm with an adjusted score of less than 0.40 may only have one poll in the tracker at a time.
Susan Boyle Reply April 27, 2026, 12:57 pm Why hasn’t this been updated since January 2026? Can you update? Thank you!
A Newt Shosteck Reply May 8, 2026, 10:55 pm Hello! We are currently working on a lot of projects (with a very small team). We’re looking to get the Trump Approval Tracker up and running again within the next few weeks.
Why hasn’t this been updated since January 2026? Can you update? Thank you!
Hello! We are currently working on a lot of projects (with a very small team). We’re looking to get the Trump Approval Tracker up and running again within the next few weeks.