What Is Happening Here?
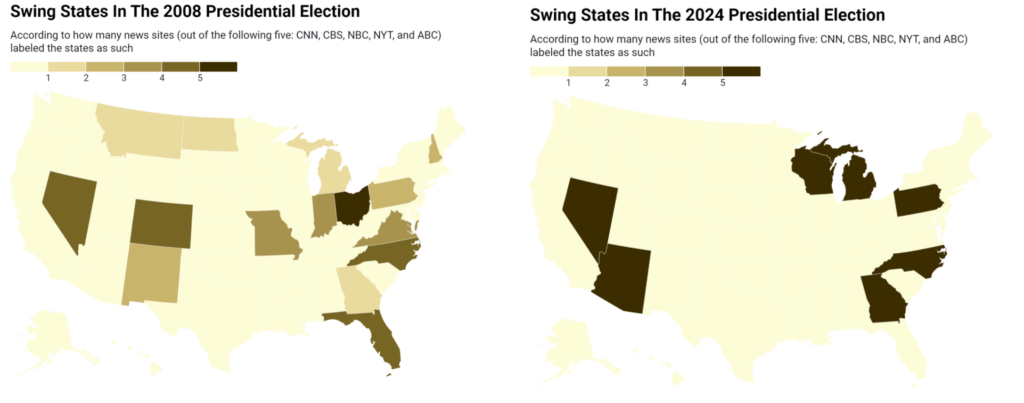
In the 2008 presidential election, the only universally agreed upon swing between the five news organizations used in this sample was Ohio. News sites couldn’t agree on what states would determine the results of the election, with CNN even classifying North Dakota as a tossup (Obama was actually polling 2% ahead according to their data). 15 states were highlighted as potential swing states by the news sites used to create the 2008 map, and Ohio was only the 6th closest state in 2008. Fast forward to 2024, the five sites that couldn’t form a general consensus on the 2008 election suddenly were honing in 7 swing states that were crucial to Trump’s win.
The largest factor that played in the agreement of these political forecasts was an improvement in polling. From the CNN 2008 map that I linked earlier, only 2 polls were conducted in North Dakota and they were inconsistently conducted. Nowadays, 538 has a numerical ranking they use to weigh the accuracy of different pollsters before adding their polls to a list of state fundamentals that are largely unchanged throughout an election season. In fact, 2024 was one of the best years of polling in the 21st century. The 7 identified swing states were all the closest states in the election (with the exception of Minnesota and New Hampshire, but those states still voted for the predicted winner). When pundits said this election was a 50/50, people jumped to the wrong conclusion of thinking that the margin of victory in every swing state would be close and we would have something like the 2000 election. In reality, it was just a matter of who would likely sweep a majority (or all) of the swing states.
What Is There to Be Improved on?
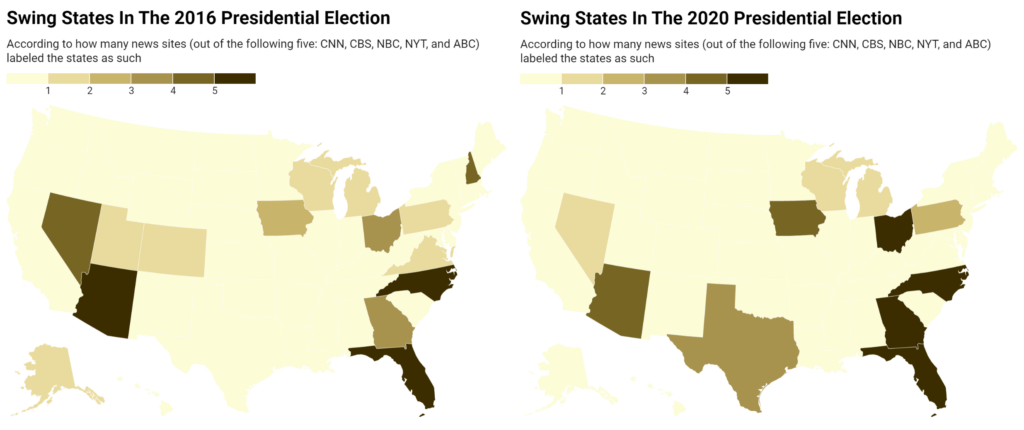
For starters, election terminology is objectively terrible and confusing. Depending on what news site or political forecast you’re on, they might use the term “swing state” or they might use the term “key race” or “battleground state” or “tossup” and so on. The issue with this is that some sites change what each of these terms mean. If you take a look at CNN’s 2020 battleground state map, you’ll notice that states such as Colorado, Virginia, New Hampshire, and Minnesota were on there. Not a single one of these states came within 5% of flipping, and CNN’s own John King even reviewed a completely different battleground map under the “Race to 270” title which is often used to show swing states. It’s also worth noting the term “tossup” is typically used to describe a state that is roughly 50-50, or at least less than ~60% probability for one candidate winning. While on the other hand, a swing state can be anywhere between a ~20-80% certainty for one candidate winning and is usually categorized as such throughout an entire election season. Additionally, terminology isn’t the only issue that the current form of swing states face.
When the News Got it Wrong
As recently as 2020, swing state calls missed the mark. One of the closest states in the entire election, Wisconsin, was only considered a swing state by 1 out of the 5 sources used for the data set. In another instance of missing the mark, Utah and Alaska were both considered competitive states by the New York Times. And although not captured by the map, Utah was considered only lean republican by other publications such as NBC. This was generally a bit absurd considering Utah was the most Republican state in the country, voting +48% for Romney just 4 years earlier. Trump did end up losing a considerable amount of support, but this could mostly be attributed to Romney’s overwhelming favorability in the state considering both his religious affiliation and status as a U.S. senator. Those two factors would never be enough to bring a state from R+50 to D+1 in a singular presidential term. And while these are fun data points to look at, there’s a whole other issue with swing states that I haven’t addressed.
In Hindsight…
Political forecasts and news organizations also like to look at what states were truly the closest or “swingiest” in an election cycle. The biggest issue with this is that there is no consensus as to what defines a swing state in the past tense. If you want to follow usafacts.org, a state is automatically a swing state if the margin of victory comes down to less than 3%. This is an incredibly flawed way to define a swing state, as a small margin of victory doesn’t always indicate it was reasonable for both parties to win. A state like Minnesota usually votes within D+10, yet it has voted for the Democratic candidate in every presidential election since 1976, with no exceptions (even being the sole state to vote for Mondale in 1984). Not only this, but if you follow the logic used by brilliantmaps.com to represent what the “swingiest” states are of the modern day using margin of victory from every presidential election since 1992, you will not get an accurate answer. The statewide politics of Tennessee and Kentucky have become way more conservative and less competitive than a state like Texas, which was considered a swing state as recently as 2020 by the Cook Political Report. Though if not margin if victory, how else could you quantify a swing state after the election has occurred?
The first (and more simple) idea one might come up with to easily quantify swing states is to see how long it would take news sites to call each state after their vote count began. Applied to the 2024 election, that map would look like the one shown below.
To start with what this map does well, it successfully highlights 5 of the 7 swing states in a dark purple color, signifying the fact that they did indeed take a while to call. Additionally, the other 2 swing states (North Carolina and Nevada), were highlighted in a bright pink color that showed they still took at least an hour to call. Unfortunately, ten other states also belonged to that category. An even greater issue with this map is that Maine and Alaska were given the 350+ minute distinction, even though they weren’t swing states in this election (and their at-large contests rarely ever are). The reason for this, and the reason for this map being flawed as a whole, is that states count and submit votes at different speeds. Florida is still relatively competitive (as in its not R+15 yet), and yet it was called within just a minute of polls closing due to how fast that state counts its votes. And yet even though Alaska voted for Trump by similar margins to Florida in 2024, it took 959 minutes for AP to call the state. It’s an interesting metric and gets some things right, but ultimately this method is more flawed than using a set parameter for margin of victory.
The Refined Method: Est. Percentage of Votes Counted
A much more accurate concept of using race calls to define swing states is by comparing how much of the vote was needed to be counted before every state in the country was called. When applied to the 2024 presidential election, that map would look like the one shown below.
This map is clearly a much better way of determining what states are truly swing states. Not a single swing state was called before 86% of its votes were counted, and no other state was called after 85% of its votes were counted. This map also does a good job of displaying which states were more competitive than originally expected, such as Virginia which was only called when 84% of the vote was counted and New Hampshire which was only called when 83% of the vote was counted. Out of all of the swing states, it took Wisconsin and Michigan the longest to call (97%+). Those two states were also the closest in the entire election. One of the biggest issues with using this is that states count their votes in different order (ie. counting mail before in-person and vise versa) and different counties (which could have already known political leanings) could be counted in batches before an accurate sample of the state is counted. This is why the color grading of the map only starts to accelerate after the 50% mark, and a state like Nebraska which was only called when 47% of the vote was counted still appears to have a neutral color. The other downside to this map is that it’s very similar to using a simple margin of victory indicator to define swing states, which we already determined to be a flawed method.
The Solution to The Swing State Problem
There are seemingly two phases of swing states. Phase 1 being before the election (polling, fundamentals, campaign funding, rallies, etc.) and phase 2 being the election itself (margin of victory, percentage of vote counted before it was called, flips from previous elections, etc.). If forecasts want to use varying terminology to define swing states, they should use it to differentiate the two phases of swing states from each other and come up with a list of numerical and objective qualifications that a state needs to meet in order to be labeled as a swing state in each phase. Those qualifications could look something like this:
Phase 1: Anticipated Swing State
- This state must be recognized as a toss up or categorized as a swing state by at least three of the following sources: ABC, NBC, CNN, NYT, and CBS
- Both candidates must visit the state at least 3 times each throughout the election season
- Polling aggregates (Such as the following: 538, The Hill, Silver Bulletin, YouGov, and RCP) must show the state within 5 points of either candidate winning
- This state must have been won by both mainstream political parties over the course of the 5 election cycles leading up to the race
Phase 2: Statistical Swing State
- This state must have come down to a margin of victory of less than 5%
- This state must have only been called with at least 85% of the estimated vote reported by the Associated Press
- This state must have had a greater increase (or lesser decrease) in turnout than the nation did as a whole
If these qualifications were applied to the 2024 presidential election, all 7 of the known swing states would qualify as “anticipated swing states”. However, only 6 of the 7 known swing states would qualify as “statistical swing states” with Arizona being left out due to its margin of victory not being within 5%. This list of qualifications was made mostly as an example and not to be used definitively because the data is mainly based on the 2024 election. A larger sample size would be needed to determine how useful this actually is.
We Are Getting Better
Using margin of victory (the easiest swing state metric to find), I put together a data table from every election since 2008 to compare how close anticipated swing states ended up being with how many sites labeled them as swing states. Out of all five of these elections, 2024 lined up the best.

The 2024 presidential election was also the only data table on this list with less than 10 potential swing states, no margin of victories exceeding 6 points, and no states without unanimous agreement from all five news sites over their status as swing states. However, it’s still worth noting the discrepancies that exist between news sites and their terminology. For example, CNN may have only had the core seven swing states listed as such in 2024, but that didn’t stop them from categorizing Oregon as a “key race” without any particular explanation.
From looking at all of this data, it’s safe to say that we are headed in the right direction in election analytics, but we need to proceed with caution. It’s important to remember that polls, even with their infinite wisdom, can be off (like the Selzer poll in Iowa last year). They’re also not fully indicative of what the swing states will statistically be in an election cycle. However, neither is the margin of victory or any other singular metric one could use to label swing states. This is why the burden of correctly identifying these states is placed within news channels that hopefully know what they’re doing (though historically haven’t). And in the future, they may want to attempt to actually agree on what a “swing state” truly is (potentially using any of the qualifications I outlined earlier). Is it a state that both parties can reasonably win? Is it a state that is closely decided by a small margin? Is it a state that swings the outcome of an election? Or a state that swings from election cycle to election cycle? It should be something that news sites try to figure out before they start calling Utah and Oregon competitive again.
What a detailed and interesting analysis! Congratulations on your first article. Can’t wait for the next ones!
Thank you! Glad you enjoyed it.
Really great article with lots of interesting points. Being from Virginia, I find it interesting how everyone this last cycle pretty much knew the progressives would take the state, yet it still took quite a while for the call to be made.
Great article. Thanks for sharing!