
The Data Times officially launched in early January 2025, making this our debut year. We’ve published a total of seven forecasts, some of which were encompassed by the six articles that were also completed and made public last year. The site has accumulated tens of thousands of views, and we have no intention of stopping anytime soon. Since it has been a few months since an article was published, I thought it would be a good idea to wrap up the year with an analysis of our notable forecasts, articles, and trackers. Additionally, this article will also feature a sneak peek into what we have planned going into 2026 towards the end.
The Trump Approval Tracker Overview
The Trump Administration Approval Rating page generated the majority of our web traffic throughout the year, particularly during periods when no elections were being forecasted. At the beginning of the year, this model was updated several times a week. Unfortunately, we haven’t adhered to that routine, and the model has sometimes gone several weeks without being updated. In 2026, we plan on having a more concrete update schedule to avoid dealing with a backlog of 50 polls.
Following the shutdown of FiveThirtyEight, The Data Times was one of the few sites that modeled Trump’s approval for a brief period. Later on, Nate Silver (former owner of FiveThirtyEight), the New York Times, Strength In Numbers, and many other organizations created their own trackers. Currently, nine organizations are featured in our comparison chart on the Trump Approval page (and as far as I’m aware, we’re the only tracker with this chart).
What Makes the TDT Tracker Special?
The uniqueness of our model is derived from how the polls are weighted. While most models gradually reduce the influence of polls as they age, our model features a more aggressive recency formula that essentially removes all polls from the model if they’re more than a week old. This has made it react more quickly to changes in the national political landscape, something we deem especially important for the current administration.
This isn’t to say that this is the “right” way to track an approval rating, considering this method has some weaknesses as well. For instance, in a low-volume polling period, the entire model may briefly rely on just 5-10 polls. This doesn’t occur too often and is usually balanced between different firms. However, there are instances where our model has been pulled to both extremes.
While our model has sometimes been more favorable to the President than most trackers, it’s also been the most unfavorable at times. This has the benefit of making our model more unique. At the very least, it’s something people can compare to other models during a scandal or other event to see a more immediate backlash or uptick in support through the form of approval. The Trump Approval tracker is virtually the only thing on this list without a way to verify its accuracy. The rest of the article will focus primarily on forecasts and last year’s election models.
Wisconsin Supreme Court
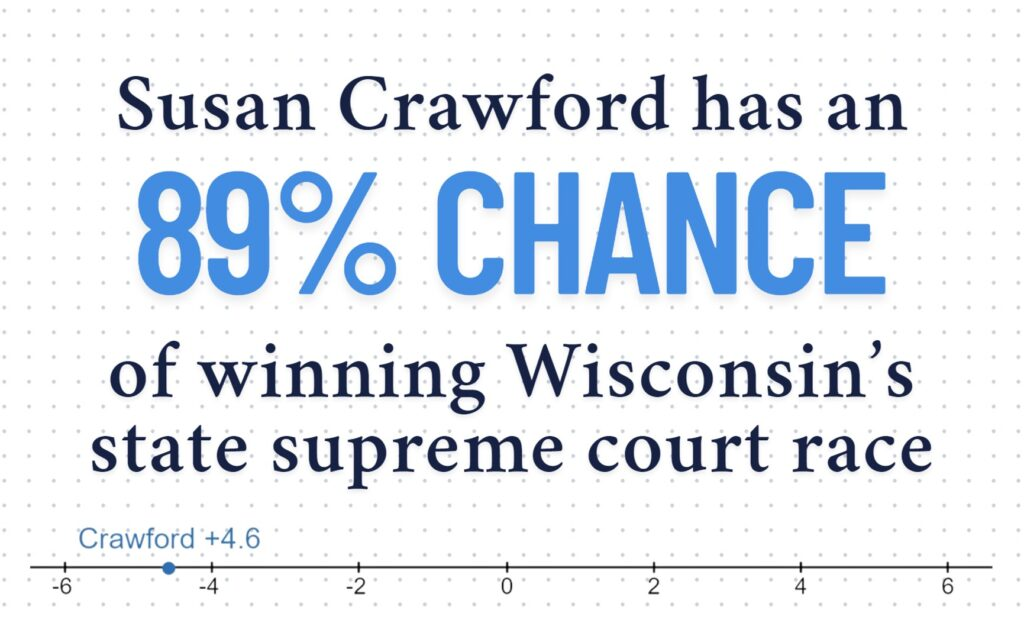
The Wisconsin Supreme Court forecast was the first finalized model we published in 2025. There were a lot of factors in this race that made it difficult to accurately project. For one, we were the only website that put out a model for the race. This meant that we had no direct references to “check” the model to ensure that it more or less aligned with consensus ratings. This was likely because of the second problem, which was that the race was sparsely polled. The final forecast ended up only relying on five polls, the vast majority of which were sponsored by Republicans (4/5 of them).
The fact that the race ended up being D +10 made this a relatively significant underestimation of the Democrats/Liberals (a theme that continued throughout the year). This was a margin that wasn’t indicated by a single poll, making it essentially a losing battle against a forecast. Despite this, our projections ended up being slightly more accurate than a simple unweighted average (by about half of a percentage point). Interestingly, Elon Musk’s funding of the Schimel campaign didn’t appear to negatively impact Crawford at all. In fact, it may have even increased her margin of victory due to the outrage against Musk’s election interference at the time.
Canadian House of Commons Overview
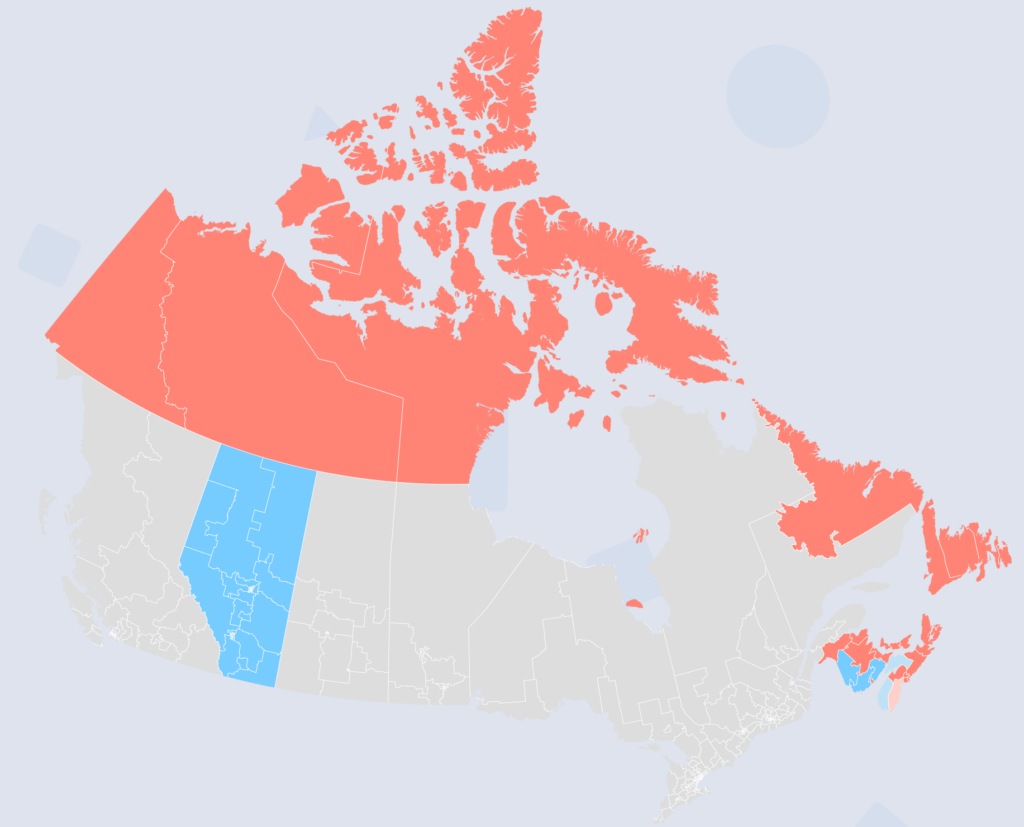
April’s House of Commons election in Canada was our first attempt at both an international election and at seat projections. It was also the only time we released a partially finalized forecast (something we hope to avoid in the future). For this election, we made models for Atlantic Canada, Alberta, and the Northern Territories. While we had initially planned to model more provinces, time got the best of the project, and unfortunately, we didn’t get to the rest of the country in time.
That being said, the forecast itself was pretty successful. The only other models I managed to find during this election were 338Canada and CBC News (though I couldn’t retrieve prior forecast data from CBC). And out of the seats that we and 338Canada both modeled, our models managed to be exactly as accurate as each other.
To be fair, there were still some seats that The Data Times accurately forecasted, which 338Canada didn’t (and vice versa). For instance, the riding (Canadian electoral district) of Edmonton Strathcona in Alberta went to the NDP. 338Canada correctly projected this, but we did not. We also have to give credit to 338Canada as our model sourced both the polls and their reliability grades from the site (though our own methodology and curving was still at play for their influence on the model).
One of the ridings that we managed to uniquely forecast accurately was the riding of South Shore-St. Margarets in Nova Scotia. It was considered one of the “swing” or “tipping point” ridings in the race, and we accurately projected it for the LPC.
Were We Truly Accurate?
When the page for the forecast was published, we put a disclaimer in the notes saying, “This model is in its very early stages of development and is likely to have a lot of inaccuracies. For a more reliable and thoroughly tested model, we suggest going to 338Canada or CBC.”
The reason I’ve mentioned the ridings we accurately projected or the overall legitimacy of the two models is simply for the point of reference that our model managed to be decently accurate, exceeding my own personal expectations. Ultimately, its biggest weakness was underestimating the NDP, something 338Canada struggled far less with (despite both of our models failing to project the NDP holding on to Nunavut).
Additionally (and as seen above with the ratings accuracy), our specific ratings and vote share projections for each riding were another point of weakness. A riding was more likely to go to the favored party if it was characterized as “Lean” rather than Likely. While the tilt and safe categories were around the percentage they should be (~50% and ~>99%), the two middle ratings could have been improved. In the future, we hope to get a more accurate picture of those ratings by ensuring all of our published models have the complete projections for every seat in an election.
Polish Presidential Overview
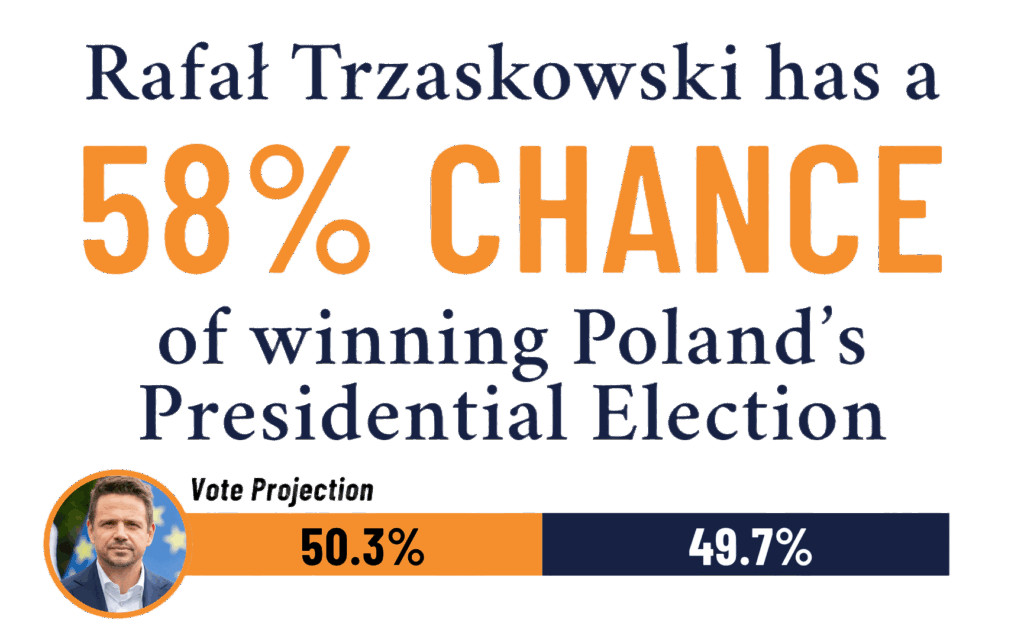
The Polish Presidential election was the first election we forecasted where the statistically favored candidate ended up losing the election. Overall, our projections were still well within the margin of error. We only ended up overestimating Trzaskowski by 1.2%, and the forecasted odds kept this race within the tilt/tossup category.
The biggest failure with this model was how strong Trzaskowski’s chances were at its launch. Nothing monumental happened in the race to justify his decline from 99% odds to just 58%. While this can be attributed to just weaker polling early on (or perhaps a gradual change in the minds of voters over the couple of months heading into the election), his odds shouldn’t have ever been that high. This is something we fixed with our later models (such as Virginia and New Jersey) by adding levels of uncertainty into the margin of error.
Factors such as the time until the election, the quality and quantity of polls, etc., all reduced the favored candidates’ odds when the newer forecasts were launched later in the year. Despite this, this older model was overall pretty accurate. It correctly forecasted the two qualifiers for the runoff election, as well as the placement of the two candidates in the first round. Since Poland has a two-round system, we at least secured the opportunity to get one of said rounds right. This election also revealed a trend of polls underestimating the populist right in Europe during 2025.
Norwegian Parliamentary Overview
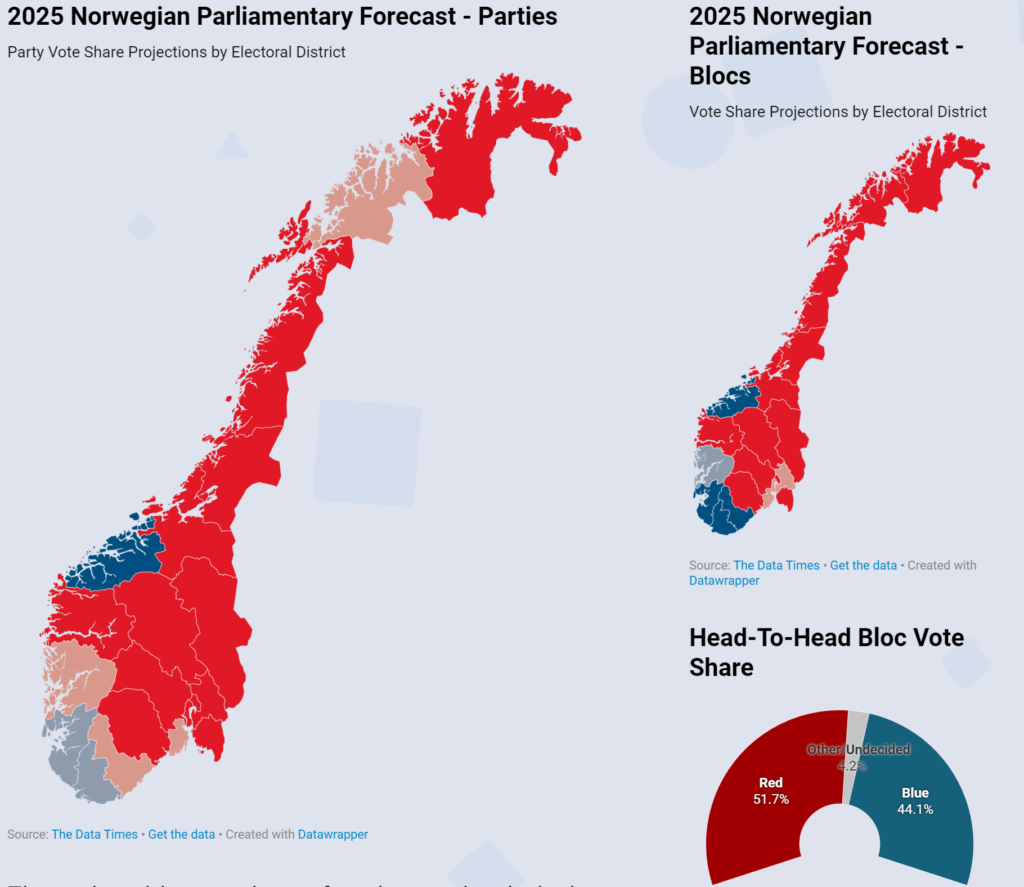
The Norwegian Parliamentary forecast was the most complicated model we have released to date. Not only did it include vote share projections for the 9 mainstream political parties in all 19 electoral constituencies, but it also forecasted how those vote share projections would translate to seat allocation using a modified version of the Sainte-Laguë method. Additionally, we forecasted the “adjustment” seats each party would be granted as well. The task of doing that was particularly difficult due to the fact that multiple parties were polling right at the 4% threshold needed to qualify for those seats.
Similar to the Polish Presidential Election, the populist right-wing FrP massively overperformed polling. Out of the five websites I found that modeled this election, not a single one managed to forecast the entirety of the FrP’s support. Additionally, the centrist liberal party Venstre received only 3.7% of the nationwide vote share, which entitled them to only 3 seats rather than the projected 7.
Despite this, we hit the mark on several parties. The Red and Socialist Left parties received exactly 9 seats as projected. The Christian Democrats earned 7 seats, meeting their projections as well. And although not right on the mark, the Labour Party was projected to win 51 of the 53 seats they ended up securing. Lastly, the Conservatives obtained 24 out of the 25 seats they were forecasted to win.
Compared to the accuracy of other, more well-established models, we were right in the center. While outperformed by the Norwegian polling database Polls of Polls and the lesser-known Estimite, we managed to outperform the locally known organizations of NRK News and PolitPro. We were also the only model to place the same in both charts, indicating some consistency in our seat allocation.
Virginia Attorney General
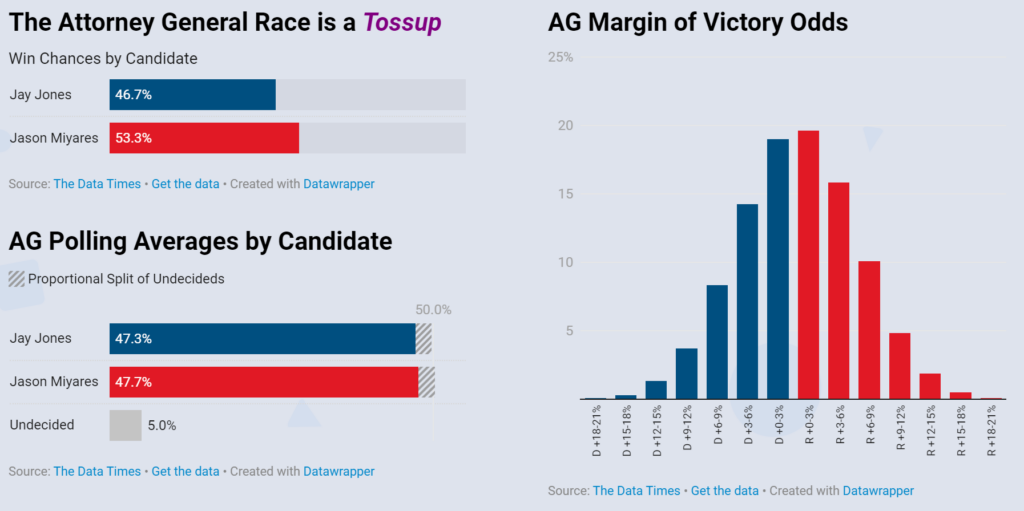
In what was potentially one of the most surprising upsets of the year, scandal-plagued Jay Jones won Virginia’s AG race by a margin greater than Kamala Harris’s in 2024. After leaked text messages and a reckless driving charge were revealed in October, Jones was faced with nothing but negative polling for nearly the entirety of the remainder of the election. A poll from Roanoke College even claimed incumbent Republican Jason Miyares was up by 8 points.
Ultimately, Jones won the race by more than 6 points. While this was still a significant underperformance of Spanberger’s margin (which we’ll look at later), it was a decisive victory that handed a 14-point polling error to Roanoke. Our model had a 7-point polling error. Somehow, this made it the most accurate out of nearly every model of the race. The only model that projected a Jones win was State Navigate, though their projections resembled those of an individual polling firm rather than a forecast. State Navigate had Jones in the lead even when every other recent poll had Miyares up.
Projections by Website
When creating the AG model, we considered adding a partisanship factor due to Spanberger’s considerable polling lead. Ultimately, we decided against it and opted instead to introduce more uncertainty into the probability forecast. While we stand by that decision, the results of this election indicate that something needs to be changed in our models going forward.
The last few polls released before the election either had Jones in the lead or the race tied. As a result of this, future models will place a greater emphasis on polls published right before the election. Rather than using the recency formula applied throughout the election season, the model will value more recent polls to a much greater degree in its final days. This will be applied universally, as the pattern of polls dramatically swinging in the last few days of a campaign occurred in other elections as well (such as the Netherlands).
Virginia & New Jersey Gubernatorial
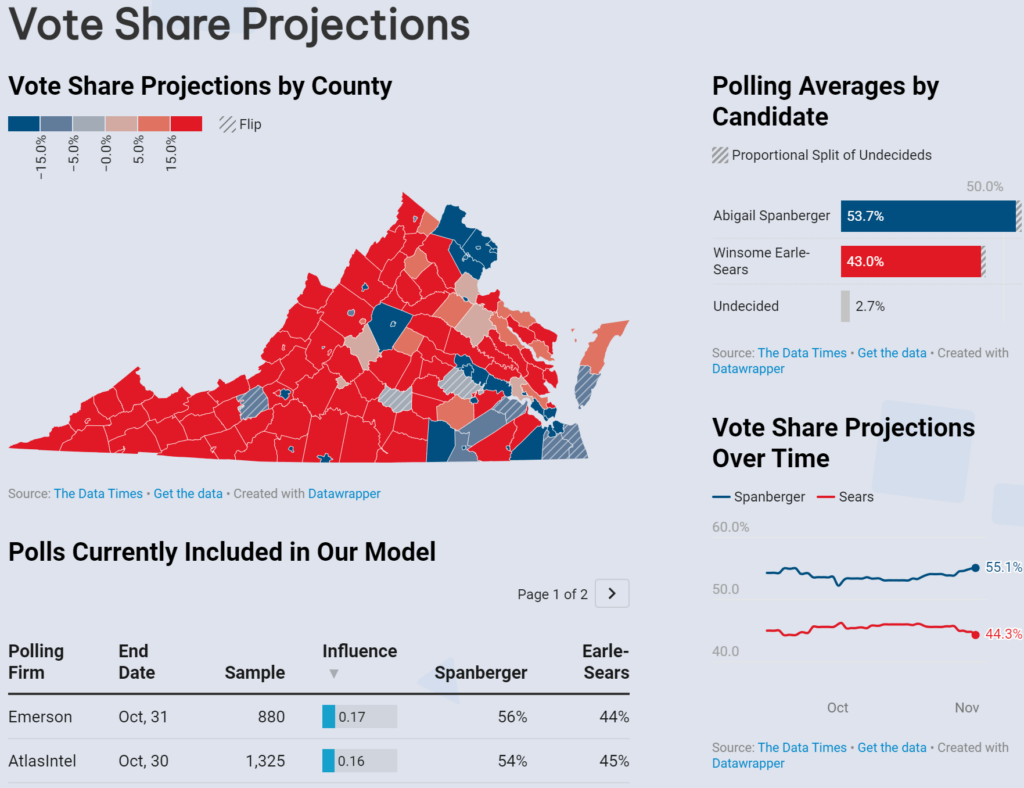
While these races initially seemed competitive (particularly New Jersey’s), they both concluded in decisive victories for the Democrats. Mikie Sherrill won New Jersey by 14 points, and Abigail Spanberger won Virginia by 15. Similar to the Democrats in virtually every other U.S. election in 2025, they were both underestimated. Luckily for us, not nearly to the same extent as Virginia’s Attorney General race.
Out of every model that wasn’t influenced by their own polling, The Data Times was the most accurate for both Virginia’s and New Jersey’s gubernatorial elections. That being said, we were still decently behind the real margins of both candidates. The results of this election also support the need for a greater emphasis on last-minute polling, considering the subtle but sudden widening of the trendlines in both races towards the end of the campaign.
The most unique parts of these models were the county projections. The use of a logistic regression to taper the support of a candidate in different counties was unique to these two forecasts. Overall, they were pretty decent and forecasted most of the competitive counties within a reasonable error. They definitely need a lot of tweaking for the future, and they shouldn’t be as aggressive, but they managed to get the accuracy shown below:
The Takeaway
While some of our models had some inaccuracies in their projections, they overall performed a solid job and compared to (even exceeding in some cases) the accuracy of more mainstream models that have existed for years. Long term, we hope that The Data Times can become a universal hub for international election forecasting and political analysis. For the plethora of models we have planned for this year, we plan on implementing the following changes:
- Recent polls will be valued to a greater degree as Election Day approaches.
- The collection of populist right political parties that are typically underestimated in polling will have calculated boosts to their projections in accordance with recent regional elections.
- Projections for subdivisions in elections will be made with a less aggressive regression and will be thoroughly tested to account for different election outcomes.
- Polls in European elections will be weighted using a new TDT pollster grading system that will take historical deviations and party biases into account.
What’s Planned for 2026?
The Data Times plans to expand its electoral forecast coverage across five continents this year. We currently have 18 forecasts planned for 2026, more than doubling the forecasts we published last year (we’ll see how many of those we actually get to). Some of these forecasts will be grouped into a single page, known as the “Mini Models,” if they have sparse polling or are hyper-local (although they will still appear on the forecast map).
Alongside the publishing of this article, we’ve released this year’s first forecast (Portuguese Presidential). This forecast includes an all-new visual layout that we’ll be implementing across our models this year. We’ve also created a page for our planned forecasts this year, which can be viewed under the TDT Forecasts category in the main menu. Additionally, we’ve upgraded the interactive tooltip UI for this year’s forecast catalog. To view a comparison between last year’s finalized catalog and the plans we have for this year, refer to the visuals below or navigate to our catalog pages.