
Last updated and locked at 4/1/2025 at 11:14 AM ET
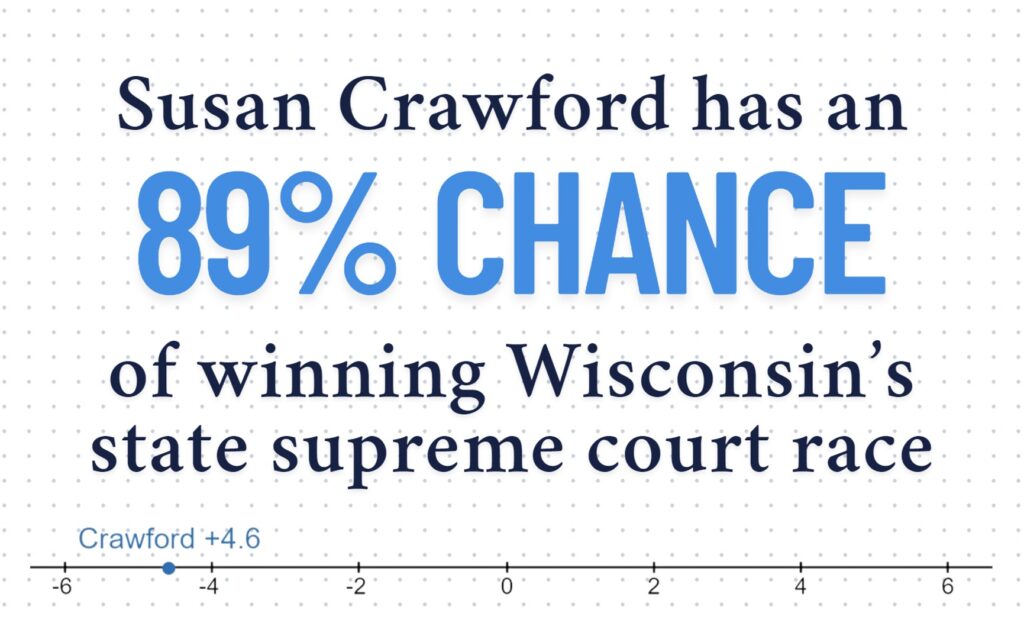
*Chances for victory margins determine how likely a candidate is to win at least those margins and are not specifically limited to them. It’s also important to note that while a Crawford win is likely, a coordinated polling error in favor of her across just a few polls could be painting a false picture of this race.
Methodology
This is a predictive, non-determinate model, which tests the likelihood for each general election candidate in the Wisconsin state supreme court race to win. It’s based on a weighted polling average (currently consisting of only five polls as this race hasn’t been highly surveyed) with similar poll valuing methodologies to the VA 2025 Gubernatorial race and the Trump Approval Tracker. It’s worth noting that the Date Influence Score is more lenient in this model, and the Sample Score is adjusted to accommodate the ideal sample for a statewide poll rather than a national poll.
That being said, the adjusted poll score is still based on the same curve that follows Nate Silver’s 2025 pollster ratings (though we plan on making our own in the future). Initially, the weighted polling average projects a simple vote share for each candidate using the values below.
| Metric | Variable (X) Definition | Equation | Weight |
| Date Influence Score | Days prior to median surveying date of most recent poll | =0.0001(x)^3 | 46% |
| Sample Score | Amount of people surveyed in this poll | LV=0.435(0.25x-130)^(1/7) RV=0.435(0.25x-180)^(1/7) | 23% |
| Poll Score | Numerical value assigned to Silver’s letter grade | =x | 31% |
After this is calculated, a normal distribution approximation (using z = (x – μ) / σ) is used to get a value that is then converted using a Z Table that assigns final probability estimates for each candidate and their respective victory margins.
| Variable | Definition | Assigned Value |
| x | Schimel projected vote share | 45.69 |
| μ | Crawford projected vote share | 50.07 |
| σ | Weighted margin of error | 3.64 |